Figure 2#
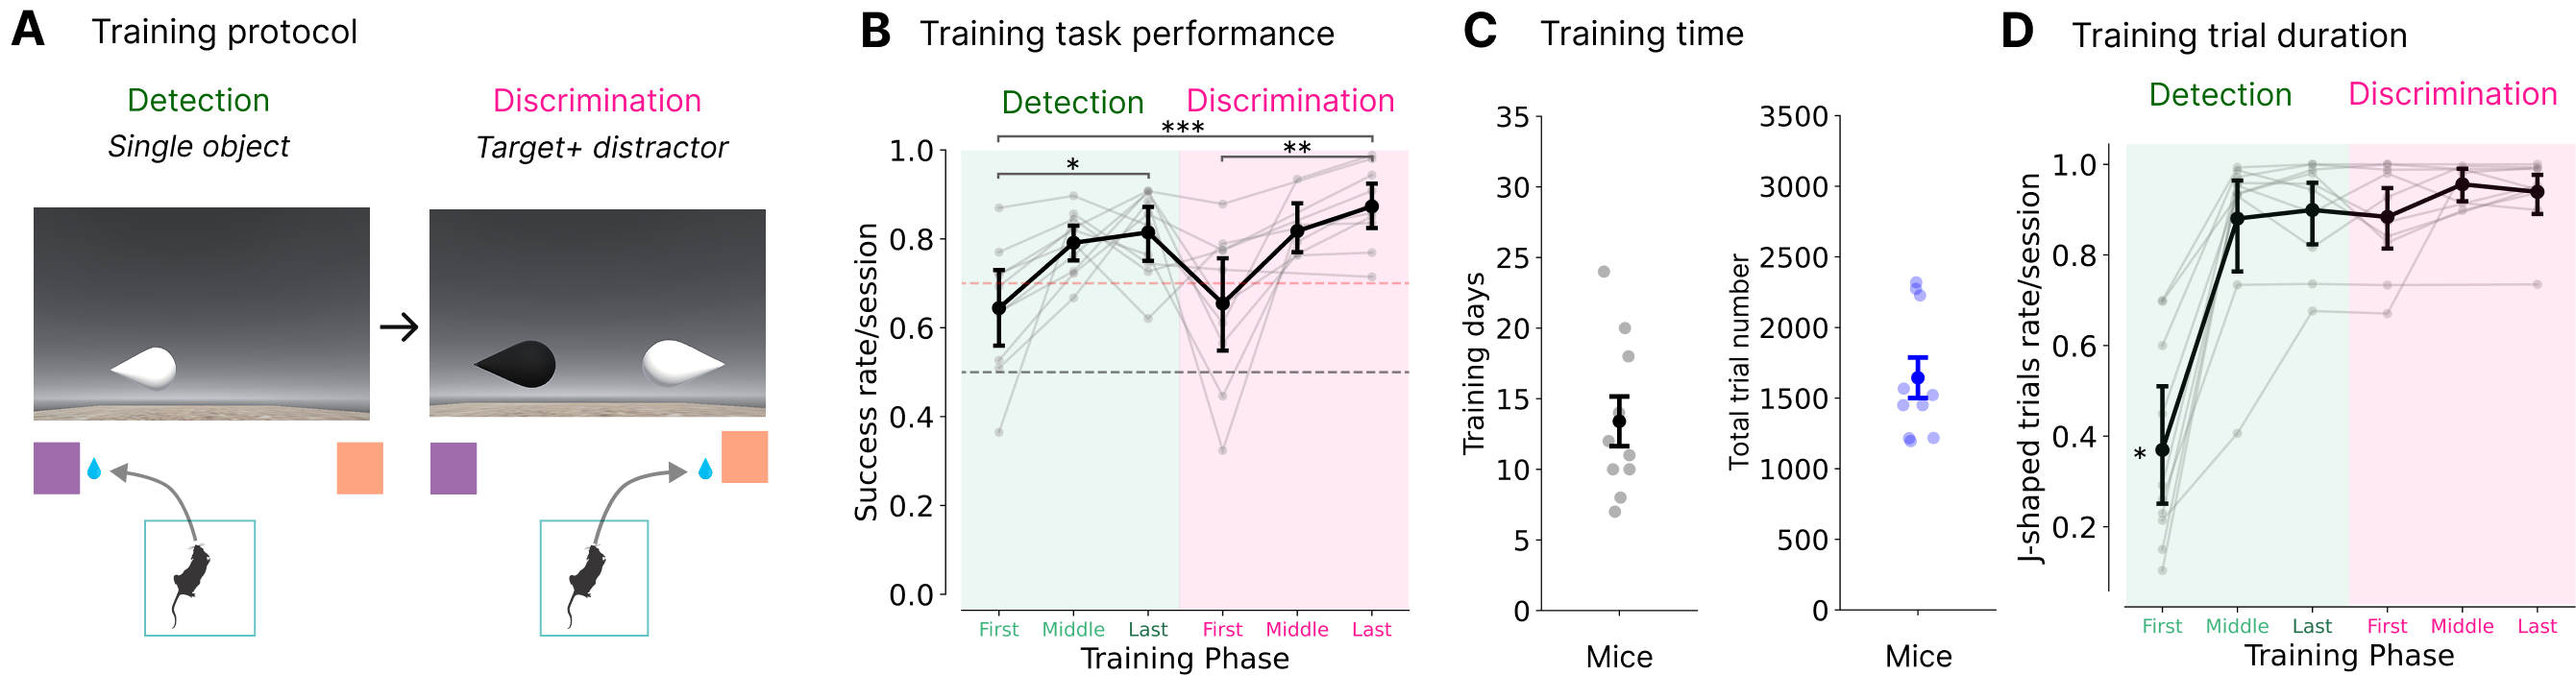
Mice can learn to discriminate objects based on luminance in a motion-parallax correct virtual reality world.#
For reference, here is the full figure
and corresponding supplemental figure
cd "/app/"
%run env.py
%run run.py connect
import pandas as pd
import matplotlib.pyplot as plt
import seaborn as sns
import numpy as np
from scipy import stats

from vr4mice.analysis import plotting
from vr4mice.schema.session_metrics import SessionMetrics
from vr4mice.analysis.analysis import style
from vr4mice.analysis.utils import get_training_stage_per_mouse
from vr4mice.analysis.stats import plot_training_stats_heatmap

import statsmodels.api as sm
from statsmodels.formula.api import ols
import statsmodels.formula.api as smf

style()

save_fig_path = "notebooks/Paper_figures/Figure_output/"
data = []
for stage in ["ar_detection_no_velthr", "ar_detection_velthr", "ar_discrim"]:
    training = (vr4mice.Groups() * vr4mice.Labels() & (vr4mice.Dataset() & f'session_label = "{stage}"')).fetch("dataset", as_dict=True)
    for d in training:

        dataset_name = d["dataset"]
        print(dataset_name)
        df = pd.DataFrame((SessionMetrics() & f'dataset = "{dataset_name}"').fetch(as_dict = True))
        split_d = dataset_name.split("_")
        df["mouse_name"] = split_d[0]
        df["date"] = split_d[1]
        df["attempt"] = split_d[2]
        df["training_stage"] = stage
        df["lab_id"] = ((vr4mice.Collab() & f'dataset = "{dataset_name}"') * vr4mice.Labs()).fetch("lab")[0]
        data.append(df)
big_df = pd.concat(data)

big_df["session_increment"] = (
    big_df.groupby("mouse_name")["dataset"]
    .rank(method="dense", ascending=True)
    .astype(int)
)

# remove failed session need to correct in datajoint - there was a second attempt run I need to correct its label
big_df = big_df [big_df.dataset != "Lemming_2024-08-09_1"].copy()
combined_training_df = []
for mouse_name in big_df.mouse_name.unique():
   tmp_df = get_training_stage_per_mouse(big_df, mouse_name)
   combined_training_df.append(tmp_df)
session_df = pd.concat(combined_training_df)
Mean Training plots#
# Linear Mixed Model (with Mouse)
lmm_model = smf.mixedlm("session_reward ~ C(num_train_stage)",
                        data=session_df, groups=session_df["mouse_name"]).fit(method='bfgs')

# Ordinary Least Squares (without Mouse)
ols_model = smf.ols("session_reward ~ C(num_train_stage)", data=session_df).fit()

# Likelihood Ratio Test
lr_stat = 2 * (lmm_model.llf - ols_model.llf)
p_val = stats.chi2.sf(lr_stat, df=1) # 1 degree of freedom for the random effect

print(f"LRT Statistic: {lr_stat:.4f}")
print(f"P-value for Mouse effect: {p_val:.4f}")

if p_val > 0.05:
    print("Justification: Mouse identity does not significantly improve the model. Independent ANOVA is valid.")
else:
    print("Caution: Mouse identity still explains significant variance.")
fig, ax = plt.subplots(1,1, figsize=(5,5))
plotting.plot_training_phases(ax, data=session_df, y="session_reward", ylabel="Success rate / Session")#, hue="mouse_name")

plt.savefig(save_fig_path + "figure2_reward_mouse.svg", transparent=True)
fig, ax = plt.subplots(1, 2, figsize=(10, 5))

plotting.plot_training_phases(ax[0], data=session_df, y="session_reward", ylabel="Success rate / Mouse", ylim=(0,1), hue="lab_id")

results = sm.stats.multicomp.pairwise_tukeyhsd(session_df.session_reward, session_df.num_train_stage, alpha=0.05)
plot_training_stats_heatmap(ax[1], results)

plt.savefig(save_fig_path + "figure2_success_rate.svg", transparent=True)

anova_rewarded = ols('session_reward ~ num_train_stage',
             data=session_df).fit()
table = sm.stats.anova_lm(anova_rewarded, typ=1)
print("Anova", table)
fig, ax = plt.subplots(1, 2, figsize=(10, 5))
plotting.plot_training_phases(ax[0], data=session_df, y="session_tortuosity", ylabel="Trial tortuosity", hue="lab_id")

results = sm.stats.multicomp.pairwise_tukeyhsd(session_df.session_tortuosity, session_df.num_train_stage, alpha=0.05)
plot_training_stats_heatmap(ax [1], results)

plt.savefig(save_fig_path + "figure2_tortuosity.svg", transparent=True)

anova_rewarded = ols('session_tortuosity ~ num_train_stage',
             data=session_df).fit()
table = sm.stats.anova_lm(anova_rewarded, typ=1)
print("Anova", table)
fig, ax = plt.subplots(1,2, figsize=(10,5))
plotting.plot_training_phases(ax[0], data=session_df, y="session_trial_duration", ylabel="Time to report (s)", hue="lab_id")

results = sm.stats.multicomp.pairwise_tukeyhsd(session_df.session_trial_duration, session_df.num_train_stage, alpha=0.05)
plot_training_stats_heatmap(ax [1], results)

plt.savefig(save_fig_path + "figure2_trial_duration.svg", transparent=True)


anova_rewarded = ols('session_trial_duration ~ num_train_stage',
             data=session_df).fit()
table = sm.stats.anova_lm(anova_rewarded, typ=1)
print("Anova", table)
session_df["session_bias_index"] = 2 * session_df["session_bias"] - 1

fig, ax = plt.subplots(1,2, figsize=(10,5))
plotting.plot_training_phases(
    ax[0],
    data=session_df,
    y="session_bias_index",
    ylabel="Choice bias index",
    ylim=(1, -1),
    hue="lab_id",
)
ax[0].hlines(0.0, xmin=0, xmax=session_df.num_train_stage.max(), color="grey", linestyle="--")

# One-sample t-test of bias against 0 (null) per training stage
stage_tests = []
for stage in sorted(session_df.num_train_stage.unique()):
    vals = session_df.loc[session_df.num_train_stage == stage, "session_bias_index"]
    t_stat, p_val = stats.ttest_1samp(vals, 0)
    stage_tests.append({
        "num_train_stage": stage,
        "n": len(vals),
        "mean_bias": vals.mean(),
        "t_stat": t_stat,
        "df": max(len(vals) - 1, 0),
        "p_value": p_val,
    })
stage_tests_df = pd.DataFrame(stage_tests)
print("One-sample t-tests vs 0 (bias)")
print(stage_tests_df)

# Plot p-values only (no bar/box)
ax[1].plot(stage_tests_df["num_train_stage"], stage_tests_df["p_value"],
           marker="o", linestyle="-", color="k")
ax[1].axhline(0.05, color="grey", linestyle="--")
ax[1].set_xlabel("Training stage")
ax[1].set_ylabel("p-value (vs 0)")

# Define tick positions and labels
stage_positions = np.arange(6)
stage_labels = ["First", "Middle", "Last", "First", "Middle", "Last"]
stage_colors = [
    "#3FB47C",
    "#3FB47C",
    "#1F6F49",
    "#FF1493",
    "#FF1493",
    "#FF1493",
]
ax[1].set_xticks(stage_positions)
ax[1].set_xticklabels(stage_labels, rotation=0, fontsize=12)
# Color the x-tick labels
for j, label in enumerate(ax[1].get_xticklabels()):
    label.set_color(stage_colors[j])

plt.savefig(save_fig_path + "figure2_bias.svg", transparent=True)
from statsmodels.stats.multitest import multipletests

session_df["session_bias_index"] = 2 * session_df["session_bias"] - 1

# One-sample t-test of bias against 0 (null) per training stage
stage_tests = []
for stage in sorted(session_df.num_train_stage.unique()):
    vals = session_df.loc[session_df.num_train_stage == stage, "session_bias_index"].dropna()
    if len(vals) > 1:
        t_stat, p_val = stats.ttest_1samp(vals, 0)
        stage_tests.append({
            "num_train_stage": stage,
            "n": len(vals),
            "mean_bias": vals.mean(),
            "t_stat": t_stat,
            "df": len(vals) - 1,
            "p_value": p_val,
        })

stage_tests_df = pd.DataFrame(stage_tests)

# Apply False Discovery Rate (FDR) Correction
rejected, p_adjusted, _, _ = multipletests(stage_tests_df["p_value"],
                                            alpha=0.05,
                                            method='fdr_bh')

stage_tests_df["p_value_fdr"] = p_adjusted
stage_tests_df["significant_fdr"] = rejected

print("One-sample t-tests vs 0 (bias) with FDR Correction")
print(stage_tests_df[['num_train_stage', 'n', 'p_value', 'p_value_fdr', 'significant_fdr']])


fig, ax = plt.subplots(1, 2, figsize=(10, 5))

# Plot training phases
plotting.plot_training_phases(
    ax[0],
    data=session_df,
    y="session_bias_index",
    ylabel="Choice bias index",
    ylim=(1, -1),
    hue="lab_id",
)
ax[0].hlines(0.0, xmin=0, xmax=5, color="grey", linestyle="--")

# Plot p-values
# FDR-adjusted p-values in red and the raw ones in grey for comparison
ax[1].plot(stage_tests_df["num_train_stage"], stage_tests_df["p_value_fdr"],
           marker="o", linestyle="-", color="crimson", zorder=3)
ax[1].plot(stage_tests_df["num_train_stage"], stage_tests_df["p_value"],
           marker="x", linestyle=":", color="grey", alpha=0.5, zorder=2)

ax[1].axhline(0.05, color="black", linestyle="--", linewidth=1)
ax[1].set_xlabel("Training Phase")
ax[1].set_ylabel("p-value (vs 0)")
ax[1].set_yscale('log')

# Define tick positions and labels
stage_positions = np.arange(len(stage_tests_df))
stage_labels = ["First", "Middle", "Last", "First", "Middle", "Last"][:len(stage_tests_df)]
stage_colors = ["#3FB47C", "#3FB47C", "#1F6F49", "#FF1493", "#FF1493", "#FF1493"][:len(stage_tests_df)]

ax[1].set_xticks(stage_tests_df["num_train_stage"])
ax[1].set_xticklabels(stage_labels, rotation=0, fontsize=12)

# Color the x-tick labels
for j, label in enumerate(ax[1].get_xticklabels()):
    if j < len(stage_colors):
        label.set_color(stage_colors[j])

plt.tight_layout()
plt.savefig(save_fig_path + "figure2_bias.svg", transparent=True)
fig, ax = plt.subplots(1,2, figsize=(10,5))
plotting.plot_training_phases(ax[0], data=session_df, y="session_max_trial_number", ylabel="Total number of trials", hue="lab_id")

results = sm.stats.multicomp.pairwise_tukeyhsd(session_df.session_max_trial_number, session_df.num_train_stage, alpha=0.05)
results.summary()
plot_training_stats_heatmap(ax[1], results)

plt.savefig(save_fig_path + "figure2_max_trial_number.svg", transparent=True)

anova_rewarded = ols('session_max_trial_number ~ num_train_stage',
             data=session_df).fit()
table = sm.stats.anova_lm(anova_rewarded, typ=1)
print("Anova", table)
fig, ax = plt.subplots(1,1, figsize=(5,5))
plotting.plot_training_phases(ax, data=session_df, y="session_jshaped", ylabel="J-shaped trials rate/session")#, hue="mouse_name")

plt.savefig(save_fig_path + "figure2_jshaped_mouse.svg", transparent=True)
fig, ax = plt.subplots(1,2, figsize=(10,5))
plotting.plot_training_phases(ax[0], data=session_df, y="session_jshaped", ylabel="J-shaped trials rate/session", hue="lab_id")

results = sm.stats.multicomp.pairwise_tukeyhsd(session_df.session_jshaped, session_df.num_train_stage, alpha=0.05)
results.summary()
plot_training_stats_heatmap(ax[1], results)

plt.savefig(save_fig_path + "figure2_jshaped.svg", transparent=True)

anova_rewarded = ols('session_jshaped ~ num_train_stage',
             data=session_df).fit()
table = sm.stats.anova_lm(anova_rewarded, typ=1)
print("Anova", table)
Training days and number of trials per mouse#
training_days = big_df.groupby(["mouse_name"], as_index=False)["dataset"].nunique()
training_days["trials"] = big_df.groupby(["mouse_name"], as_index=False)["session_max_trial_number"].sum()["session_max_trial_number"]
training_days
training_days.mean(numeric_only=True), training_days.sem(numeric_only=True)
fig, ax = plt.subplots(1,2,figsize=(5,5))
sns.stripplot(
    data=training_days,
    y="dataset",
    color="black",
    jitter=True,
    size=8,
    alpha=0.3,
    zorder=0,
    ax=ax[0]
)

sns.pointplot(
    data=training_days,
    y="dataset",
    join=False,
    color="black",
    markers="o",
    errorbar="se",
    capsize=0.1,
    errwidth=3,
    zorder=2,
    ax=ax[0]
)


ax[0].set_ylim(0,35)
ax[0].set_ylabel("Training days")

sns.stripplot(
    data=training_days,
    y="trials",
    color="blue",
    jitter=True,
    size=8,
    alpha=0.3,
    zorder=0,
    ax=ax[1]
)
sns.pointplot(
    data=training_days,
    y="trials",
    join=False,
    color="blue",
    markers="o",
    errorbar="se",
    capsize=0.1,
    errwidth=3,
    zorder=2,
    ax=ax[1]
)

ax[1].set_ylim(0,3500)
ax[1].set_ylabel("Total trials")
plt.tight_layout()
plt.savefig(save_fig_path + "figure2_days_and_trials.svg", transparent=True)